Multi-collinearity Visualization plots
plot.mcvis.RdMulti-collinearity Visualization plots
Multi-collinearity Visualization plots
Multi-collinearity Visualization plots
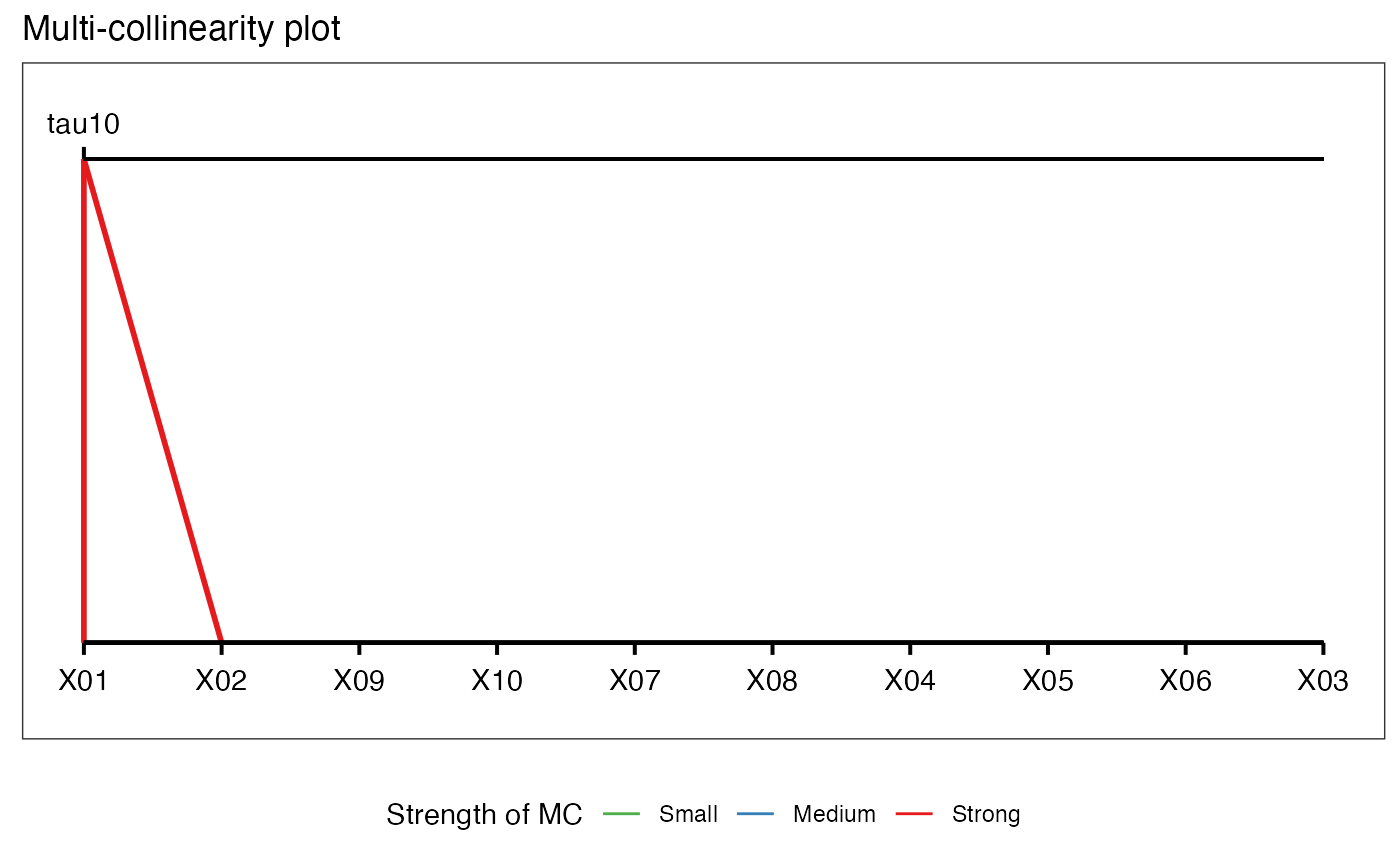
alt_mcvis(mcvis_result, eig_max = 1L, var_max = ncol(mcvis_result$MC))
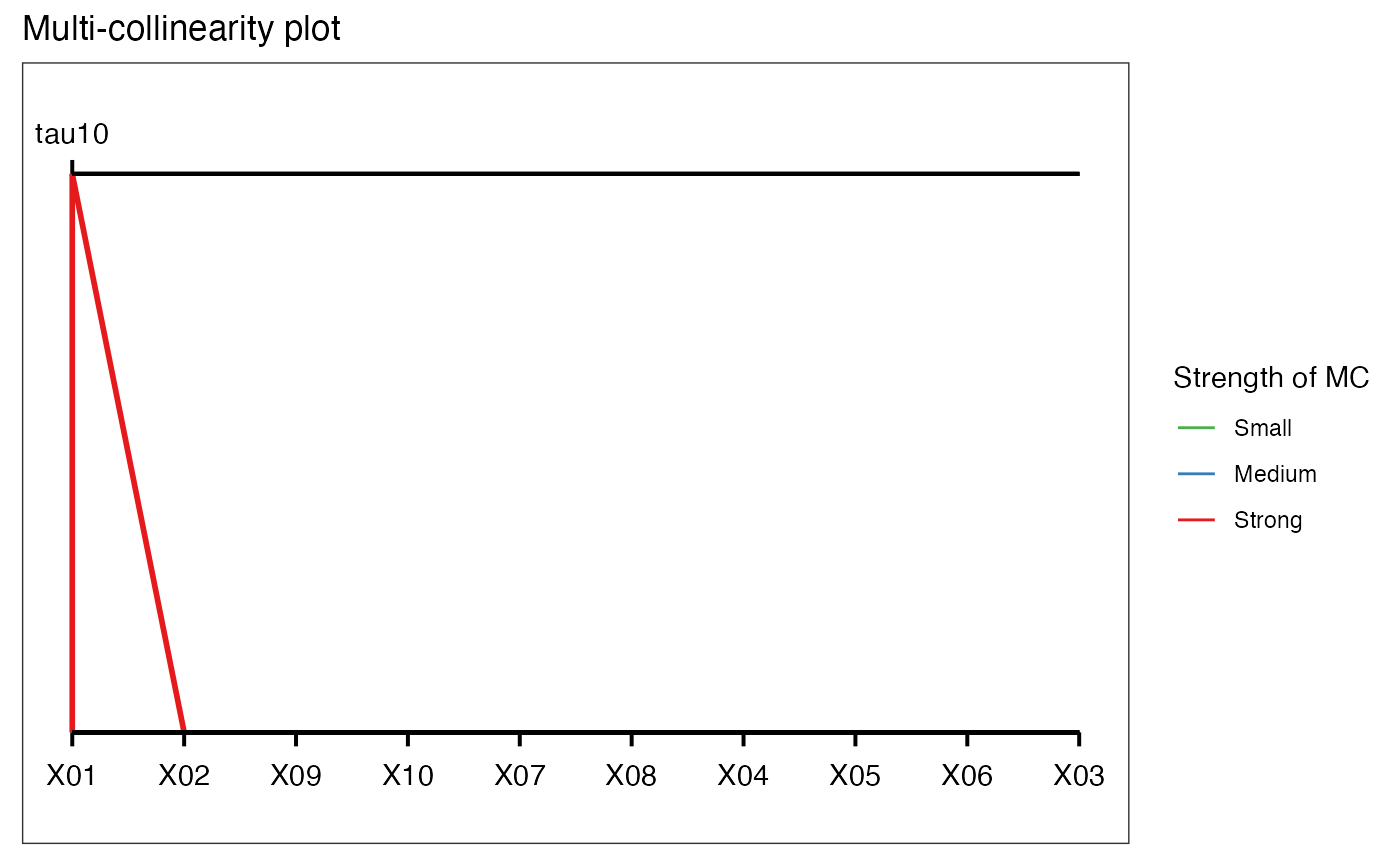
ggplot_mcvis(
mcvis_result,
eig_max = 1L,
var_max = ncol(mcvis_result$MC),
label_dodge = FALSE
)
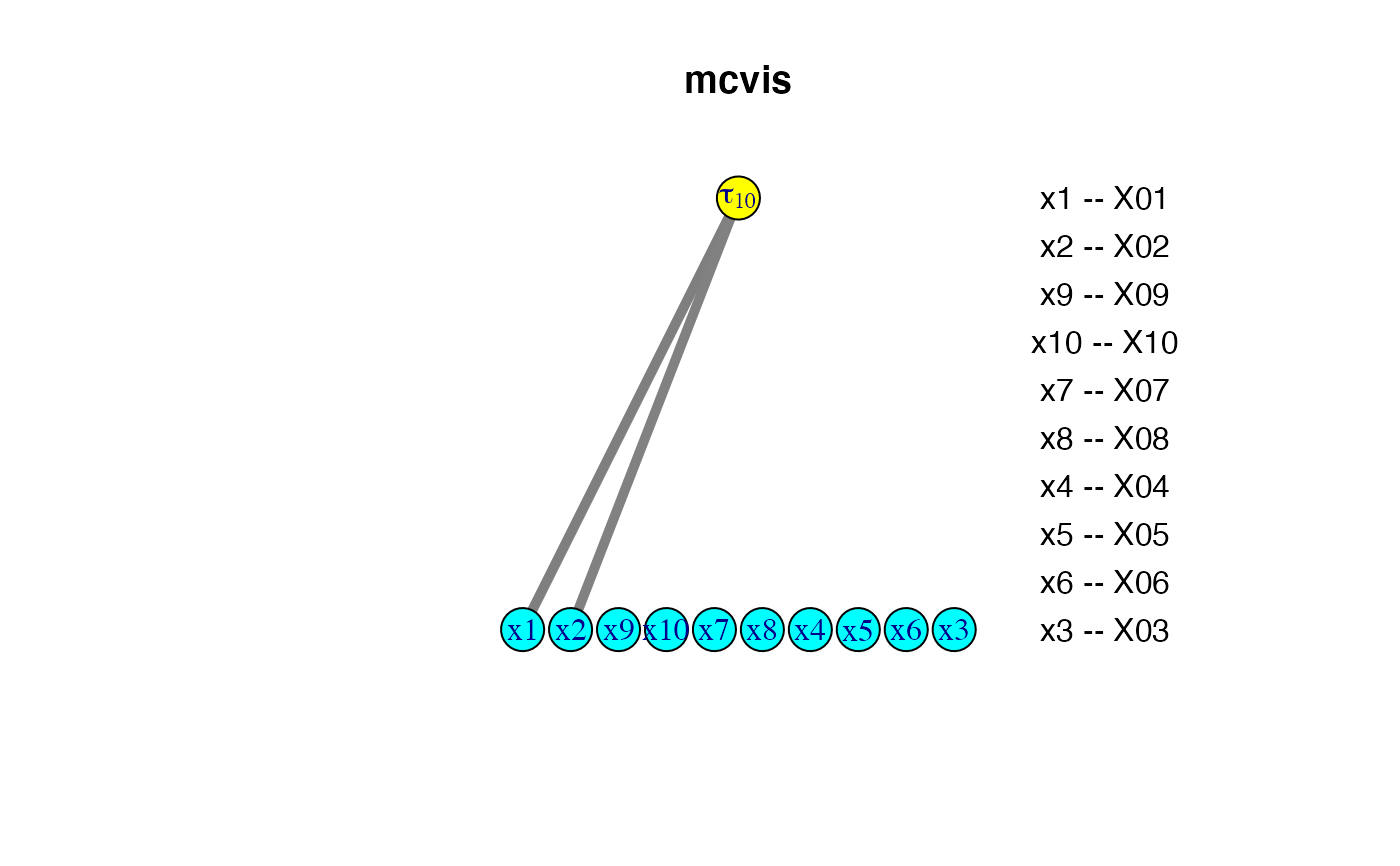
igraph_mcvis(mcvis_result, eig_max = 1L, var_max = ncol(mcvis_result$MC))
# S3 method for mcvis
plot(
x,
type = c("ggplot", "igraph", "alt"),
eig_max = 1L,
var_max = ncol(x$MC),
label_dodge = FALSE,
...
)Arguments
| mcvis_result | Output of the mcvis function |
|---|---|
| eig_max | The maximum number of eigenvalues to be displayed on the plot. |
| var_max | The maximum number of variables to be displayed on the plot. |
| label_dodge | If variable names are too long, it might be helpful to dodge the labelling. Default to FALSE. |
| x | Output of the mcvis function |
| type | Plotting mcvis result using "igraph" or "ggplot". Default to "ggplot". |
| ... | additional arguments (currently unused) |
Value
A mcvis visualization plot
Author
Chen Lin, Kevin Wang, Samuel Mueller