Generic plotting function for class apes
# S3 method for apes
plot(x, type = "path", ...)
Arguments
- x
An object of class
apes- type
Type of plot: (only supporting "path" at the moment)
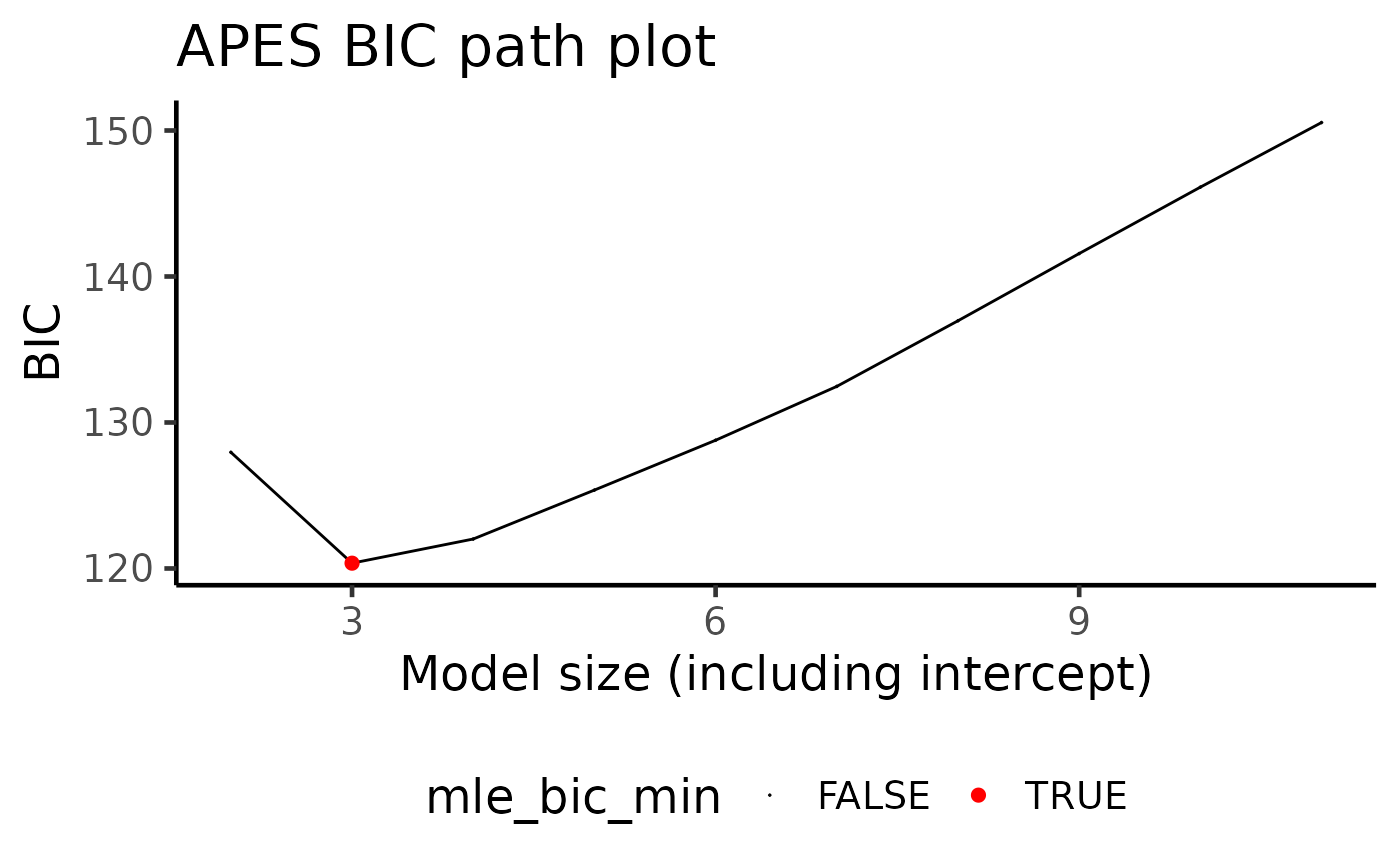
"path": Information criterion vs model size. Either "AIC" or "BIC" can be shown using the order argument.
- ...
additional parameters (not currently used)
Value
A ggplot output corresponding to the select plotting type.
Examples
set.seed(10)
n = 100
p = 10
beta = c(1, -1, rep(0, p-2))
x = matrix(rnorm(n*p), ncol = p)
colnames(x) = paste0("X", 1:p)
y = rbinom(n = n, size = 1, prob = expit(x %*% beta))
data = data.frame(y, x)
model = glm(y ~ ., data = data, family = "binomial")

apes_result = apes(model = model)
#> No variable size specified, searching all sizes from 1 to p...
plot(apes_result)